Anatomy of a REITs Research Report
Real Estate Investment Trusts (REITs) own or finance income-producing real estate and distribute most of their taxable income as dividends. Because they are inherently yield vehicles, investors assess them through cash-flow stability, balance-sheet resilience, and valuation versus peers and bonds. A good REIT report therefore combines property fundamentals, financing structure, and pricing logic to judge whether the income is sustainable and fairly valued. The goal is not just to list metrics, but to guide a reader from a stated call to the evidence that supports it.
A clear, logical flow helps turn data into conviction. A professional REIT report should be structured around how investors actually evaluate income-producing assets — focusing on cash-flow stability, financial resilience, and valuation discipline. Think of the report as a courtroom brief: start with the verdict, then present the facts in an order that makes the conclusion feel inevitable.
1. Executive Summary & Thesis
Start with a concise investment call (Buy / Hold / Sell) and a one-paragraph rationale that foreshadows the evidence to come. Mention the price target, implied upside/downside, and how the stated catalysts or risks will move the distribution profile.
Highlight key drivers such as yield outlook, asset quality, leverage trend, and macro sensitivity. In two to three sentences, preview what will be proven later: "We rate Buy because improving logistics occupancy offsets higher funding costs, keeping the 6.2% yield secure while P/NAV trades at a 10% discount."
2. Revenue & Cash Flow Analysis
Focus on how the portfolio generates stable and visible distributable income, linking operational trends back to DPU visibility. Move from top-down (asset mix, geography) to bottom-up (tenant quality, lease terms), then tie these to the trajectory of cash flows after capex and interest.
Key analytical angles:
- Portfolio Mix: geography, sector exposure, and asset quality
- Tenant Profile: concentration risk and WALE (Weighted Average Lease Terms)
- Occupancy & Rent Reversion: forward growth visibility
- DPU Trend: stability and payout consistency
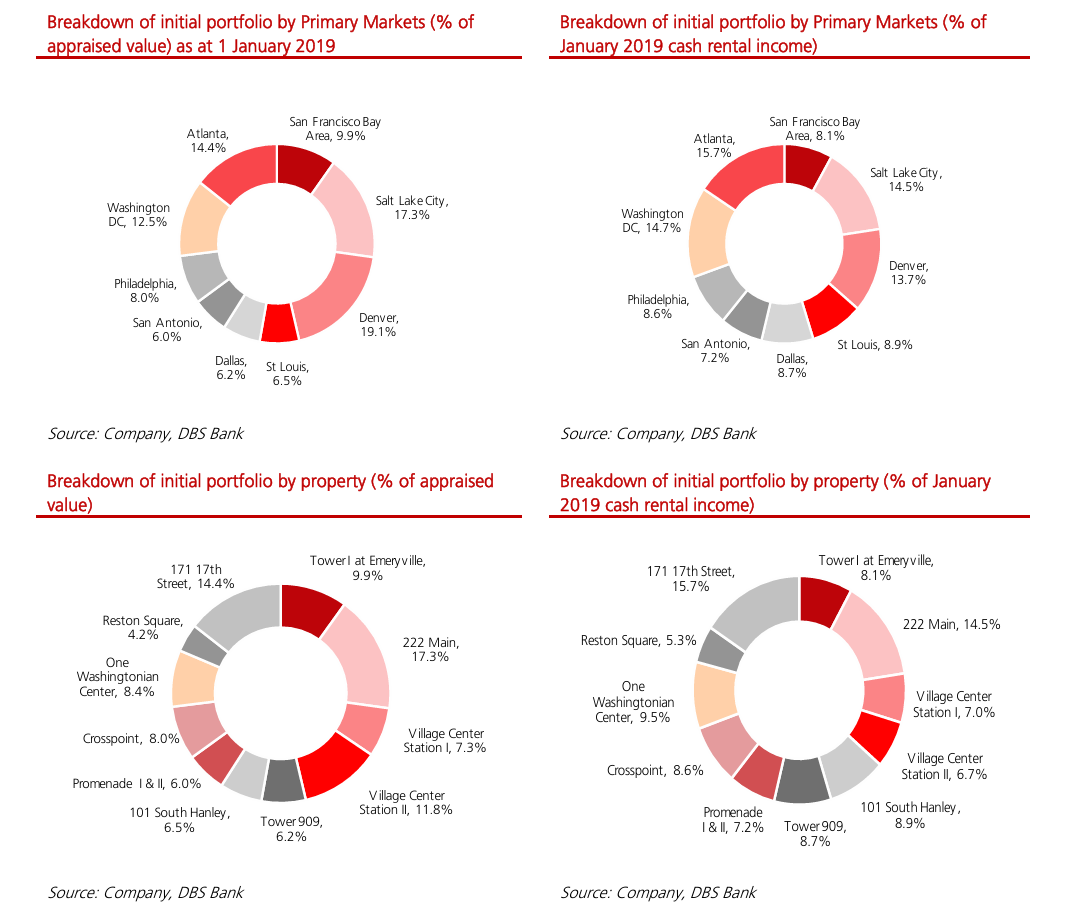
Use visuals such as Revenue by Segment or Top Tenants by Contribution to illustrate diversification and risk exposure. Clarify whether cash flows are contracted (long WALE, built-in escalations) or volatile (short leases, index-linked rents), and quantify sensitivity to vacancy or rent reversions.
Example: Portfolio Breakdown (Source: DBS)
3. Liquidity & Financial Position
Assess the REIT's financial position and leverage headroom, linking the balance sheet to distribution sustainability. Explain whether today's leverage supports growth (acquisitions, AEI) or forces deleveraging (asset sales, dividend cuts).
Core indicators:
- Gearing Ratio: debt headroom for acquisitions
- Interest Coverage: resilience to higher borrowing costs
- Debt Maturity Profile: refinancing timing risk
- Fixed vs Floating Debt: sensitivity to rate movements
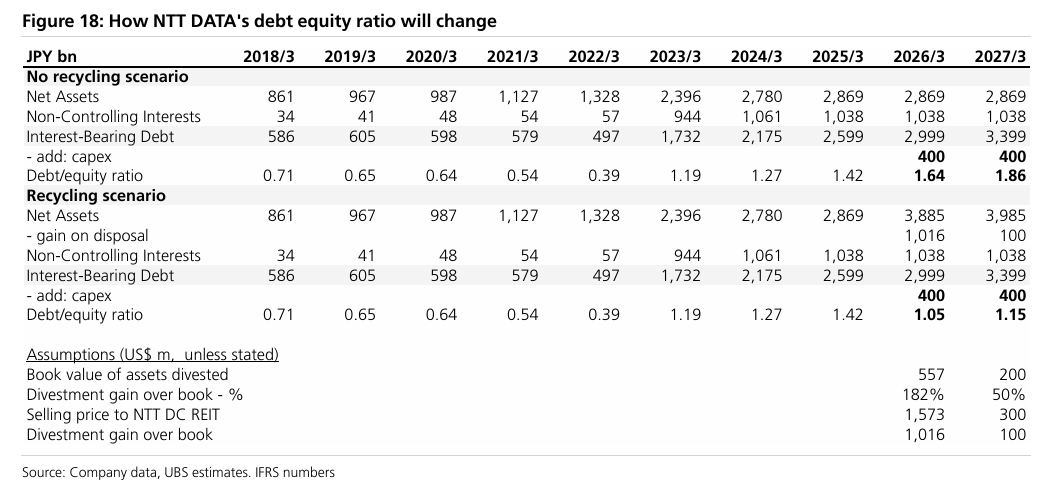
Supplement data with management commentary — e.g., refinancing intentions or capital recycling plans — to determine the future leverage roadmap. Spell out rate sensitivities ("A 50 bp hike cuts DPU by ~2% given 60% floating-rate exposure") and any covenant buffers.
4. Valuation Framework
Combine absolute and relative methods to form a rounded view. Present valuation as the bridge between fundamentals and the call: how the quality of cash flow and balance-sheet risk translates into yield, P/NAV, or target price. Show why your assumptions are credible versus consensus and history.
(a) Absolute Valuation — Dividend Discount Model (DDM)
For a multi-stage DDM, the price today is the sum of discounted dividends over the explicit forecast period plus the discounted terminal value:
Where: = intrinsic value today; = dividend (or DPU) in year ; is the cost of equity (often estimated via CAPM); is perpetual growth rate after year .
The terminal value after the forecast horizon is based on a perpetual growth assumption:
Key inputs:
- Forecast horizon: 5–10 years
- Cost of equity (): often via CAPM
- Perpetual growth (): typically 1–2 %
Run sensitivity tests on and to show valuation range.
(b) Relative Valuation — Peer Comparison
Benchmark against peers using:
| Metric | Formula | Interpretation |
|---|---|---|
| P/NAV | Price ÷ Net Asset Value | Premium/discount to book |
| Dividend Yield | DPU ÷ Market Price | Income return vs peers |
| Cap Rate | NOI ÷ Asset Value | Asset-level yield |
5. Investment Thesis & Risks
Conclude by integrating financial, operational, and qualitative insights so the recommendation feels earned. Link the drivers back to the target price ("higher occupancy supports mid-cycle rent reversions, justifying a 6.0% cost of equity and 1–2% terminal growth"). Make explicit what could break the thesis and how fast you would change the call.
Typical risks: interest-rate hikes, tenant defaults, FX exposure, or sector oversupply.
Typical mitigants: long WALE, fixed-rate debt, high-quality sponsors.
Writing Tips for Professional REIT Reports
1. Focus on Cash-Flow Sustainability over Growth
The key to REIT analysis is income sustainability, not revenue expansion. Because most REITs operate mature, yield-generating assets, investors care less about top-line growth and more about whether distributions are sustainable under different conditions.
Example: Instead of saying "Rental income grew 5% YoY," explain why — e.g., "Rental income rose due to higher occupancy in logistics assets and positive rent reversions, supporting stable DPU despite higher financing costs."
2. Integrate Quantitative and Qualitative Insights
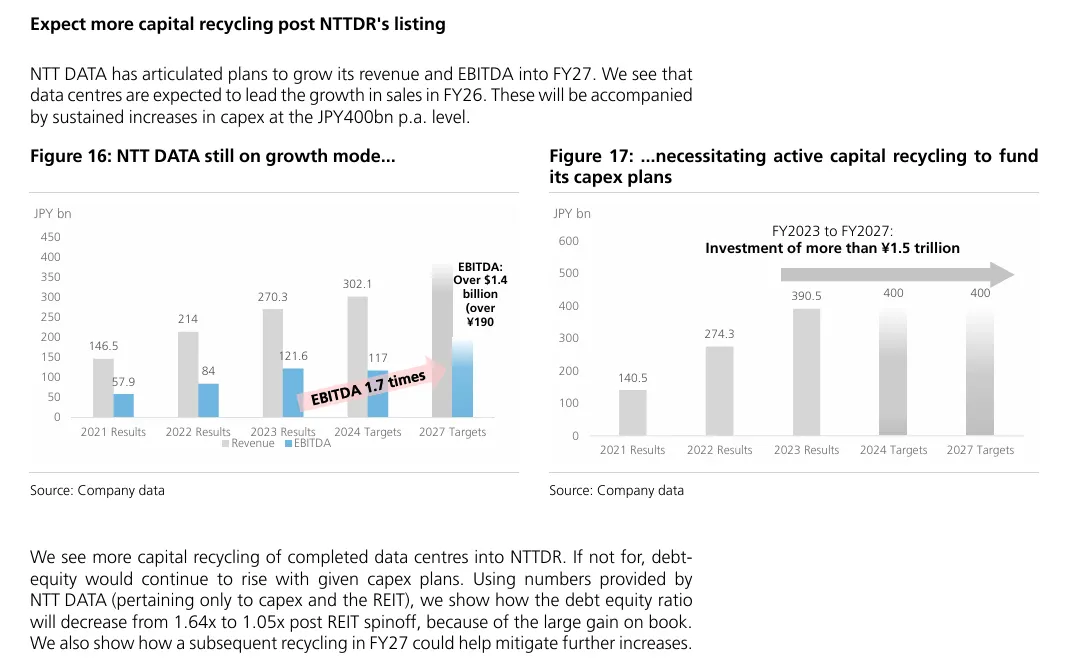
A professional report blends metrics with management guidance. Numbers alone don't tell the whole story — interpret what management actions imply for future cash flow or risk exposure.
Example: Combine Management's Expectation with Financial Data (Source: UBS)
3. Use Peer Comparisons Effectively
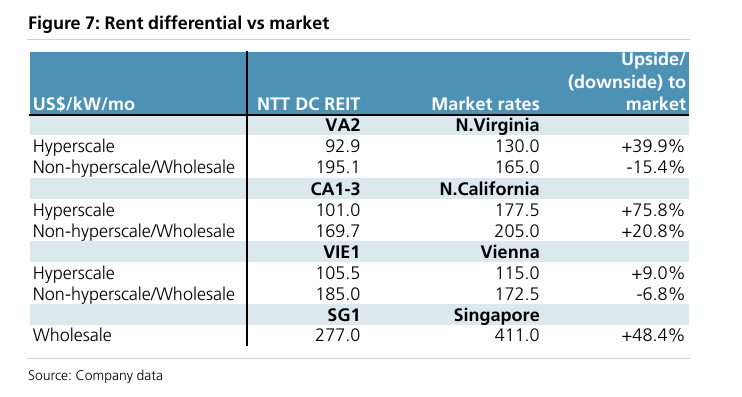
Benchmarking provides valuation context. Compare the REIT's P/NAV, Dividend Yield, and Gearing against sector peers to highlight mispricing or relative resilience.
Example: Company Data vs Market (Source: UBS)
4. Maintain Analytical Neutrality
Institutional readers expect objective tone. Avoid promotional or emotional language; instead, anchor conclusions in verifiable data and market consensus.
Example: Replace "The REIT has an excellent growth outlook" with "Portfolio rental reversions turned positive after three quarters of decline, indicating early signs of recovery."
5. Craft a Cohesive Narrative
Each analytical section — from revenue to valuation — should reinforce the same central argument: Is the REIT's income sustainable, and is the yield justified by risk?
Example: Link the pieces together: "Stable occupancy and a longer debt maturity profile underpin DPU visibility, while a 50bp yield spread over peers offers moderate upside potential."
Final Thoughts
A professional REIT report is more than a compilation of ratios — it is a structured narrative of income sustainability. The best reports connect operational metrics, management actions, and market valuations into a single story that helps investors understand how distributions today can be preserved tomorrow.
In essence, clarity, consistency, and conviction define the quality of REIT research. Numbers inform the view, but structure and reasoning make it credible.